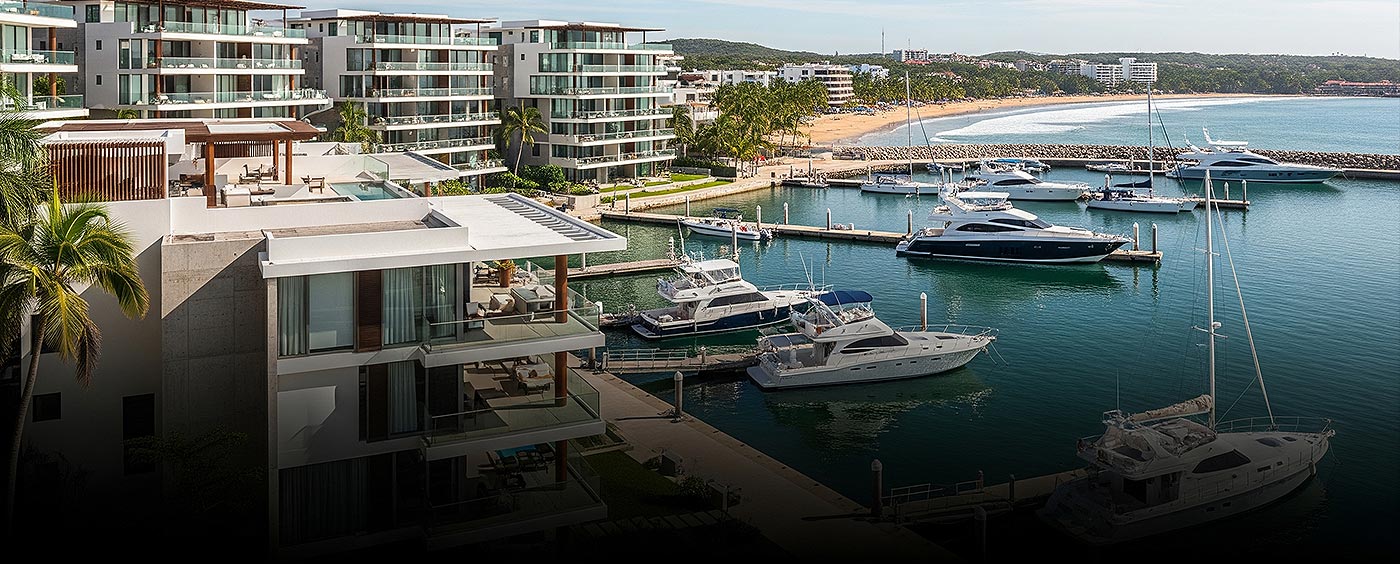
Executive Summary
The condo market in La Cruz de Huanacaxtle is showing robust activity as of July 2025, with significant year-over-year improvements indicating a shift towards a stronger seller's market. Active listings have decreased by -14.3% compared to July 2024, now standing at 180 properties, while sold listings have surged 75.0% to 7 units. Year-to-date, sales have skyrocketed 212.5% to 50 condos, reflecting heightened buyer interest despite a -8.07% drop in the average sale price YTD to $618,320. The median sale price for July rose 23.98% to $455,000, though YTD it's down -22.46% to $527,277, suggesting some affordability adjustments in the mix.
Absorption rate, representing months of inventory, has dramatically improved, falling -72.45% to 25.71 months, pointing to a faster-paced market. Average days on market (DOM) increased 25.89% to 389 days in July, but YTD it's down -8.87% to 257 days, indicating overall quicker turnovers. New listings plummeted -89.6% YoY to just 5, contributing to tighter inventory. This data, downloaded on August 5, 2025, highlights a market with growing demand, reduced supply, and opportunities for both buyers and sellers in this charming Nayarit coastal town.
Market at a Glance
Market Overview
The La Cruz de Huanacaxtle condo market has experienced a notable transformation over the past year, moving from a slower-paced environment to one with increased velocity. From August 2024 to July 2025, active listings fluctuated between 180 and 223, ending the period down -12.20% MoM and -14.3% YoY. This reduction in inventory, coupled with a sharp -89.6% drop in new listings YoY, has tightened supply significantly. Sold listings, however, have been a bright spot, holding steady at 7 in July (flat MoM) but up 75.0% YoY, with YTD sales jumping 212.5%.
Pending listings rose 100% MoM to 6, signaling continued buyer momentum, up 200.0% YoY and 147.6% YTD. Absorption rate improved markedly, declining -15.34% MoM and -72.45% YoY to 25.71 months, suggesting properties are moving faster off the market. Average DOM spiked 31.28% MoM to 389 days, yet it's down -8.87% YTD, indicating variability but overall progress.
Overall, the market shows resilience with higher transaction volumes despite some price softening YTD. This could be attributed to increased affordability drawing more buyers into the area, known for its serene beaches and proximity to Puerto Vallarta.
Key Market Indicators
- Absorption Rate: 25.71 months in July 2025, down -72.45% YoY from 93.33 and -7.17% YTD, indicating a quicker absorption of inventory.
- Average List Price (Actives): $627,465, up 15.34% YoY and 6.70% YTD to $595,151 average.
- Median List Price (Actives): $484,950, increased 15.11% YoY and 6.39% YTD to $469,000.
- Average Sale Price (Solds): $712,747 in July, surged 99.72% YoY but down -8.07% YTD to $618,320.
- Median Sale Price (Solds): $455,000, up 23.98% YoY yet decreased -22.46% YTD to $527,277.
- Average DOM: 389 days, rose 25.89% YoY but improved -8.87% YTD to 257 days.
- Median DOM: 396 days, up 98.99% YoY and 62.67% YTD to 244 days.
Pricing Analysis
Pricing in the La Cruz de Huanacaxtle condo market presents a mixed picture, with July showing strength but YTD figures revealing some downward pressure. Active average list prices climbed 1.80% MoM to $627,465, marking a 15.34% YoY gain, while new list prices were $444,200, down from higher levels earlier in the year. Sold average prices jumped 24.56% MoM and 99.72% YoY, but YTD they're softer at a -8.07% decline, possibly due to a higher volume of mid-range sales.
The sale-to-list price ratio stood at 90.3% in July, with a sale-to-original list price ratio of 87.9%, reflecting some negotiation room. Volume-wise, active list volume dropped to $112,943,708, while sold sale volume was $4,989,229. These trends suggest that while immediate pricing is firming, broader YTD data points to affordability playing a role in boosting sales volume.
Overall, buyers are finding value, but sellers in higher brackets may need to price competitively to capitalize on the faster market pace.
Listings Activity by Price Range
Activity across price ranges in La Cruz de Huanacaxtle condos is concentrated in the $250,000–$499,999 segments, which account for a significant portion of active, sold, pending, and new listings. For active listings, the $300,000–$349,999 range leads with 33 units (down -21.4% YoY), followed by $250,000–$299,999 at 17 (down -34.6% YoY). Higher-end properties ($1,000,000+) saw growth, with 24 in the $1M–$1.5M range, up 84.6% YoY, indicating luxury segment expansion.
Sold listings show strength in lower brackets: 3 in $250,000–$299,999 (N/A YoY as zero prior), and scattered activity up to $1.5M–$2M. YTD, sales are up across many ranges, like 133.3% in $300,000–$349,999. Pending listings mirror this, with 1 each in several mid-ranges, totaling 6 (up 200.0% YoY), and YTD up 147.6%, suggesting future sales in affordable tiers.
New listings were minimal at 5, mostly in $200,000–$749,999, down sharply -89.6% YoY, which exacerbates inventory tightness. YTD new listings dropped -54.7%, with declines in popular ranges like $300,000–$349,999 at -81.6%. This distribution implies a market where entry-level and mid-tier condos are hot, while luxury sees growing interest but slower turnover.
Market Trends (Visualized)
The chart below illustrates sold listings (black bars) alongside average sale prices (dark red line) over the past 12 months. Notice the peak in October 2024 with 18 sales at lower prices, contrasting with recent months where fewer but higher-priced sales dominate, reflecting a shift to premium transactions.
This visualization shows active listings (black bars) and average list prices (dark red line). Inventory peaked in April 2025 at 223 units with elevated prices, then trended down, with prices stabilizing around $600,000+, indicating a maturing market with sustained value.
The absorption rate line chart (in black) demonstrates a consistent decline from over 80 months in late 2024 to under 30 by mid-2025, highlighting accelerating market absorption and reduced oversupply.
Average DOM (black line) fluctuated significantly, with highs in October 2024 at 743 days and recent upticks, but the overall downward YTD trend suggests properties are selling more efficiently despite monthly variances.
Market Implications
For Buyers
Buyers in La Cruz de Huanacaxtle will find a more competitive landscape with inventory down -14.3% YoY and absorption improving -72.45%, meaning good deals may not last long. However, YTD median prices down -22.46% offer affordability, especially in the $250,000–$400,000 range where activity is high. Rising DOM 25.89% YoY could provide negotiation leverage, but with sales up 212.5% YTD, acting quickly is advisable.
For Sellers
Sellers benefit from tighter supply and surging sales 75.0% YoY, with average sale prices up 99.72% in July. Lower new listings -89.6% reduce competition, and faster absorption -72.45% means quicker sales. Yet, higher DOM 25.89% suggests pricing realistically to avoid prolonged listings, particularly in mid-to-high ranges.
For Investors
Investors should note the 212.5% YTD sales growth and inventory contraction, pointing to potential appreciation in this growing area. Luxury segments ($1M+) show 106.7% YTD active growth, offering flips or rentals, but YTD price dips -8.07% warrant caution. With improved absorption, long-term holds in affordable ranges could yield strong returns.
Terminology Glossary (Click to Expand)
Considering Buying or Selling?
Navigating the current Puerto Vallarta real estate market requires up-to-date information and expert guidance. Whether you're looking to buy your dream vacation home, sell your property effectively, or make a strategic investment, understanding these trends is vital. Contact Mexico Life Realty today for a personalized consultation and strategy session.
Disclaimer: This report is based on data from the local MLS for the specified period and property type. Market conditions can change rapidly. This information is intended for educational purposes and should not be considered financial or investment advice. Always consult with a Mexico Life Realty professional before making Mexico real estate decisions.
Posted by John and Christie Forget on
Leave A Comment